A threat made visible
A distributed denial-of-service attack is a flood from everywhere at once. The people defending against it needed to see it: at internet scale, at a glance.
Autonomous-network DDoS defense · two-week research, nine-week build · team of 5
The stuck thing
L3 Technologies had an internet-security product for autonomous networks — networks owned by a single entity — that detected and mitigated distributed-denial-of-service (DDoS) attacks. The mitigation engine was powerful, but its picture of an attack lived in logs and tables. At internet scale that isn’t a picture at all, and the operators running it had to grasp the threat, and the response, fast.
The diagnosis
Nothing was missing from the data; everything was missing from its shape. An attack at this scale is a structure — sources, paths, concentrations, the mitigation pushing back — and structure wants to be seen, not read. The seam was between an intensely technical system and a human who has to understand its state in seconds.
Made it go
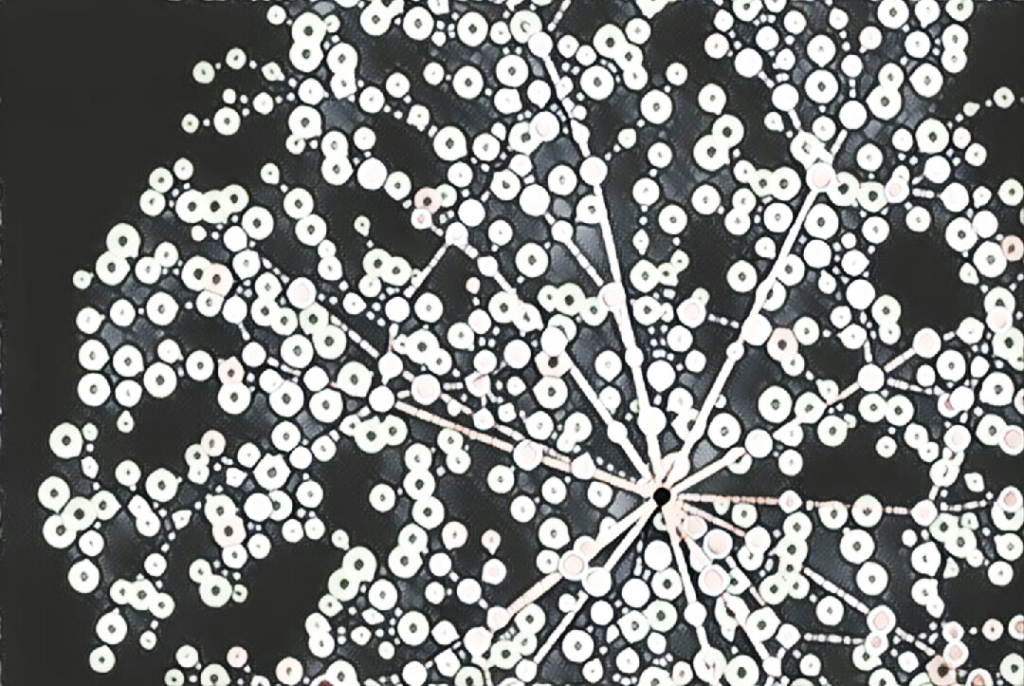
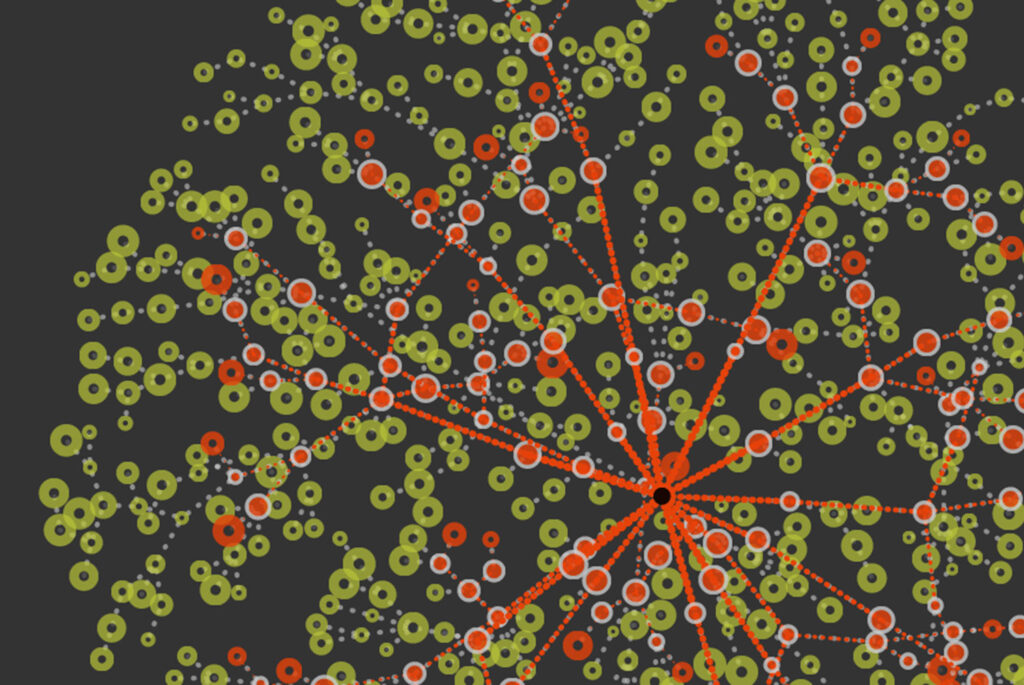
The metaphor that unlocked it came from biology: treat the security system as an immune system for the internet. On a force-directed graph with the protected system at the center, attacks cluster as red inflammation; when the mitigation activates, it pushes the inflammation back to its sources, and the network visibly returns to health. Anyone can read that picture in seconds, technical or not. The metaphor ran deeper than the picture: each autonomous network ran NOTX tuned to itself, sensing and reacting locally while coordinating with the others, the way an immune response is distributed, not commanded.
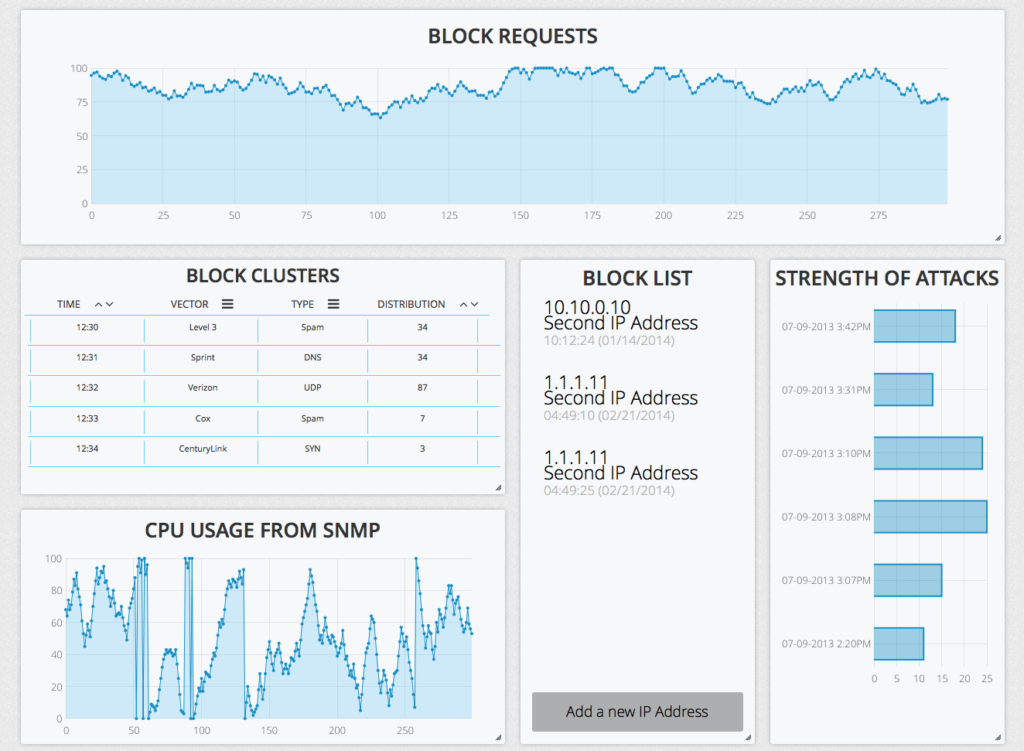
Around the visualization I designed the working dashboard: a framework of configurable widgets for policy scripting, sensor management, blocklists, and live SNMP data, which operators could arrange, extend, and create as needed. We worked in two-week sprints, demoing to the client and setting next steps each cycle. The verdict that mattered came unprompted: the client asked that the novel UI be adapted as a sales tool.
data & activity visualization · technical analysis · interaction design · two-week client sprints
← All work · Have a stuck thing? Tell me about it →